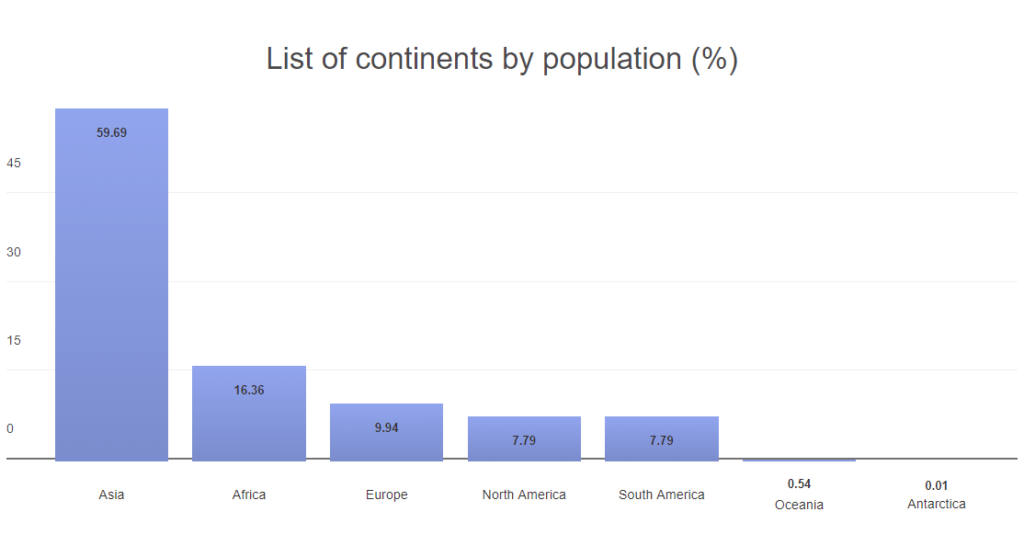
In our previous tutorial, we have explained how to implement Barcode Generator with JavaScript. In this tutorial, we will explain how to implement Dynamic Bar Chart with JavaScript, PHP and MySQL.
Bar chart or Bar Graph is used to display grouped data with rectangular bars with lengths proportional to the values that they represent. Bar charts are displayed as vertically or horizontally and can be used to display different type of data. The Bar charts are arranged to display from highest to lowest by grouping of data into discrete groups like months of year, age group, sizes etc.
So in this tutorial you will learn how to create dynamic Bar chart with JavaScript, PHP and MySQL. We will use JavaScript plugin Graphite.js to create Bar Chart. You would also like tutorial to build Event Calendar with jQuery, PHP & MySQL to implement in your next project.
We will cover this tutorial with live example to create dynamic Bar Chart.

Also, read:
So let’s create example to draw dynamic bar Chart or Graph with JavaScript, PHP and MySQL. The file structure of this example is following.
- index.php
- bar_chart.js
- chart_data.php
Step1: Create Database Table
As we will create example of dynamic Bar graph, so first we will create MySQL database table population to store details and display in Bar graph.
CREATE TABLE `population` (
  `id` int(10) UNSIGNED NOT NULL,
  `continent` varchar(255) NOT NULL,
  `pop_percent` varchar(255) NOT NULL,
  `pop_total` varchar(255) NOT NULL
) ENGINE=InnoDB DEFAULT CHARSET=utf8;
We will also insert few records to display.
INSERT INTO `population` (`id`, `continent`, `pop_percent`, `pop_total`) VALUES
(1, 'Asia', '59.69', '4,436,224,000'),
(2, 'Africa', '16.36', '1,216,130,000'),
(3, 'Europe', '9.94', '738,849,000'),
(4, 'North America', '7.79', '579,024,000'),
(5, 'South America', '7.79', '422,535,000'),
(6, 'Oceania', '0.54', '39,901,000'),
(7, 'Antarctica', '0.01', '1,106');
Step2: Include JavaScript Files
As we will use JavaScript plugin Graphite.js to create Bar chart, so we will include plugin files and jQuery files in index.php. We will also include our bar_chart.js in which make Ajax request to load chart data from MySQL database table.
<script src="https://ajax.googleapis.com/ajax/libs/jquery/2.1.3/jquery.min.js"></script>
<script src="graphite.js"></script>
<script src="bar_chart.js"></script>
Step3: Create Bar Chart Container
In file index.php, we will create bar chart HTML container with id barChart to display Bar chart.
<div class="container">
	<div class="graph" id="barChart"></div>
</div>
Step4: Create Dynamic Bar Chart or Graph
Now in our bar_chart.js file, we will make Ajax request to chart_data.php file and get response data in JSON format. Then we will call function graphite() with options to draw dynamic bar graph.
$(document).ready(function() {
	$.ajax({
		type : 'POST',
		url  : 'chart_data.php',
		dataType:'json',
		success : function(response){
			var chartData = JSON.parse(response);
			var chartOptions = {
			  'height': 350,
			  'title': 'List of continents by population (%)',
			  'width': 1000,
			  'fixPadding': 18,
			  'barFont': [0, 12, "bold"],
			  'labelFont': [0, 13, 0]
			};
			graphite(chartData, chartOptions, barChart);
		}
	});
});
Step5: Get Data from MySQL Database Table
In file chart_data.php, we will get chart data from MySQL database table population that stored population data of continents and returned as JSON to display data in Bar chart.
<?php
include_once("db_connect.php");
$sqlQuery = "SELECT continent, pop_percent FROM population";
$resultset = mysqli_query($conn, $sqlQuery) or die("database error:". mysqli_error($conn));
$population = "{";
while( $records = mysqli_fetch_array($resultset) ) {
	$population.='"'.$records['continent'].'":'.$records['pop_percent'].',';
}
$population=rtrim($population,",");
$population.="}";
$data[] = $population;
echo json_encode($data);
exit;
?>
You may also like:
- Follow and Unfollow System with PHP & MySQL
- GST Billing System with PHP & MySQL
- Restaurant Management System with PHP & MySQL
- Visitor Management System with PHP & MySQL
- Student Attendance System with PHP & MySQL
- Like and Dislike System with Ajax, PHP & MySQL
- Build Star Rating System with jQuery, PHP & MySQL
- User Registration and Login System with PHP & MySQL
- Build Contact Form with PHP and Ajax
- To-do List Application with Ajax, PHP & MySQL
- Build Event Calendar with jQuery , PHP & MySQL
- Drag And Drop File Upload with jQuery and PHP
- Drag and Drop Reorder with jQuery, PHP & MySQL
- Data Export to Excel with PHP and MySQL
- Multiple Image Upload with jQuery, PHP and MySQL
- Create Ajax Pagination with PHP and MySQL
- jQuery Datatables Server Side Processing with PHP & MySQL
- Editable HTML Table with jQuery, PHP & MySQL
- Filter Search Result with Ajax, PHP & MySQL
- Consuming RESTful Web Services using PHP
- Image Crop and Upload using jQuery and PHP
- Live Datatables CRUD with Ajax, PHP & MySQL
- Create REST API with PHP & MySQL
- Build Dynamic Image Gallery with PHP & MySQL
- Implement jQuery Bootgrid with PHP & MySQL
- Multiselect Dropdown with Checkbox using jQuery and PHP
- Autocomplete Search with Bootstrap, PHP & MySQL
You can view the live demo from the Demo link and can download the source from the Download link below.
Demo Download
Love Diagrams and all about them !
Hi,
I’m getting Connected Successfully!! database error:
Please help
Please share more details with error to help you. thanks!